From severe heat waves across southern Europe, the southern United States and China, to horrific wildfires in Hawaii (claiming many, many lives), Canada and Greece, over the summer months we have all witnessed the terrible impacts of extreme weather on environments and communities.
While these incidents are certainly evidence of unusual and extreme weather conditions, an important question is whether these are random, one-off events, or do they correlate with the changing climate? It is common in financial markets to use data to inform action and with that in mind, let’s look at some data about this summer’s weather extremes.
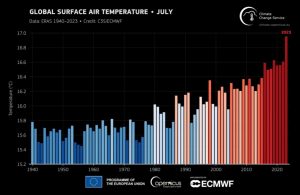
First, let’s look at some global data. In July 2023, recorded global air surface temperatures hit their highest ever monthly levels. August followed as the second hottest month on record, and September temperatures surpassed the previous record for the month by 0.5°C – the largest jump ever seen.
The first chart [below] shows comparative temperatures in July from 1940 to the present day. This data clearly shows that the world has experienced significantly warmer temperatures year on year over the last 20 years, with an apparent major leap upwards in 2023.

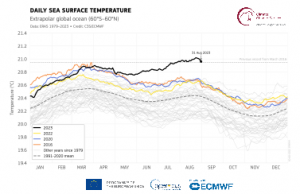
Recorded daily sea temperatures tell a similar story with average global sea temperature substantially higher than previously. Sea temperatures tend to peak in March, which may mean we’ll see a further temperature rise in the spring of 2024 and is of particular concern with respect to the impact on coral reefs and other sea life that is susceptible to higher water temperatures.

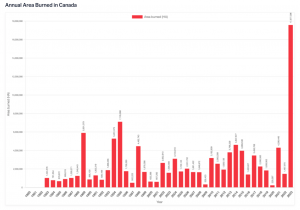
In August, I was invited to attend the Canadian Security Traders Association annual conference, and before I travelled to the event, I wanted to take a close look at the scale and impact of the wildfires. I knew from news reports that this year had seen significant forest fire activity, but I didn’t know how it compared to previous years. The data showed that back in August, fire activity was nearly double the previous recorded peak. Since that time, the total area damaged by fire continued to grow, with 2023 being 2.5 times greater than the previous record year (1995). These are facts derived from recorded data – the chart below speaks for itself.

Typically, data moves in small, incremental amounts with new ‘record levels’ marginally higher than those reached previously. These data sets show unprecedented upward shifts in temperature and, in the same time period, an enormous increase in the area burned by wildfires.
As the world heats up the language is changing, with ‘boiling’ replacing ‘warming’. It seems likely that these temperature trends will continue, along with more and more devastating impacts on the environment and communities. I don’t know about you, but this is of extreme concern to me and many others. It’s what keeps me awake at night.
Rather than speak about what actions we should be taking in response to these impacts, for now I’m going to suggest that you scroll back for another look at the charts and let the temperature and impact data fully sink in.
To be continued…

